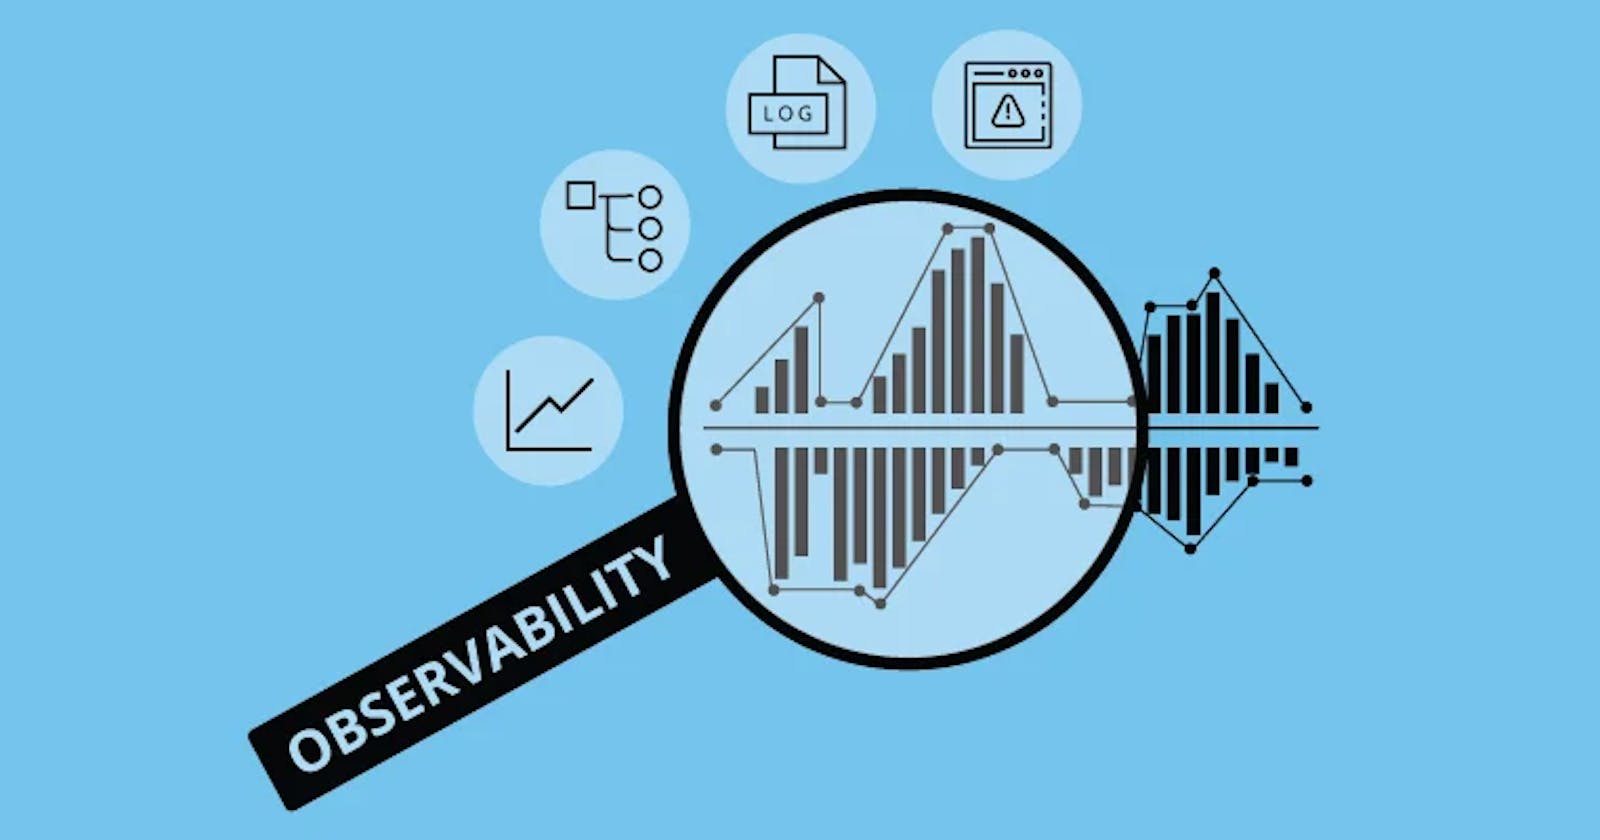
Observability in layman’s lingo
“Hi, how are you doing ?”

Credits - Marvel
A common phrase we use to greet. In response, they tell you about them in natural language and that is how you feel connected with your community.
Now, what if you had the option of asking the know-how of your software application? Won’t you feel connected with it?

Credits: Pictures from google search, self animated in procreate
Well that is exactly what Observability is.
To follow more precisely with this analogy, you as the parent of the software application teach it to produce the right answers for relevant questions. Those answers are most commonly in form of logs. More about this later, let’s switch back to defining Observability.
Observability is the art of conversing with your application so that it can communicate to you in case anything goes wrong or is about to go wrong.
Observability can also be defined as the capability of observing your software application.
Most common way of conversing with your software is Logs.
Let’s look at “the one” program that every programmer writes at-least once in their lifetime.
# My first python program
print("Hello world!")
Printing “Hello world!” when starting to learn a new programming language is synonymous to learning ABC alphabets when learning the English language.
While a simple message like “Hello world” may at first look like a getting-started statement, it is also more often known as a log line. Programmers use log lines all the time to print the state of programmatic variables, report an event in code and most importantly, print out errors when something goes wrong with the intended flow of execution. That ubiquity of Logs earns it to be the first pillar of Observability.
Along with Logs, there are two more standard pillars of Observability. Metrics and Traces.
Our focus — Metrics
Logs can be used to print out errors or state of variables in textual format.
To understand metrics, let’s try to think of a scenario where we use logs to print out a simple counter. Here is a quick example in Python:
# simple program to print out a state of a variable
variable = 0
for i in range(10):
  variable = variable + i
  print(f"variable's state at time {i} is {variable}")

# output
# variable's state at time 0 is 0
# variable's state at time 1 is 1
# variable's state at time 2 is 3
# variable's state at time 3 is 6
# variable's state at time 4 is 10
# variable's state at time 5 is 15
# variable's state at time 6 is 21
# variable's state at time 7 is 28
# variable's state at time 8 is 36
# variable's state at time 9 is 45
While logs are doing a good job of reporting the state of variable, don’t you think we are only interested with current time and the state of the variable. What if you wanted to plot out the state of the variable ?
Well, the most straight forward way would be if we could only capture/record the numbers/metrics in the log lines.
Metrics is the state of some variable reported over time. For example, cpu_usage of your machine over time.
To make the visualization and computation easier, there are 4 standard types of Metrics. Counters, Gauges, Timers and Histograms. At this point I strongly encourage you to search for them online on your favorite search engine. Comment down below if you find additional ones.
In this article, we will be focusing on Metrics and do a hands on exercise to bringup a docker based metrics pipeline on your host machine.
Hands on — Setting up your metrics pipeline
Now that we have a good understanding of Observability and Metrics, let’s dive into setting up a local Metrics pipeline.
For this hands on exercise we will use this git-hub repo. If you want to contribute please check this section of the README.
Prerequisites
Docker should be installed.
Docker-compose should be installed.
Optional — Git client. You can also Download the zip of the code.
Setup
Get the code.
With git client, clone the code with command —
git clone github.com/knowledge-transfer-org/metrics-o..
Or if you can downloaded the zip, you can skip this step.Change directory into directory **metrics-observability-pipeline —
**cd metrics-observability-pipelineRun set up script
./start-mopThat’s it. Sit back and relax. Docker will the build the relevant images and spin up the pipeline.
Go ahead and run
*docker ps | grep mop
*You will see all the mop <metrics-observability-pipeline> containers running. Check point 5 here to see the sample output.
Access Grafana
From a new browser window head to http://localhost:3000/
Enter the username and password
username: mopadmin
password: moppasswordCheck the Victoria Metrics dashboard here http://localhost:3000/d/wNf0q_kZk/victoriametrics?orgId=1&refresh=30s
Where to go from here ?
Now that you have a working pipeline, I strongly encourage you to play around with the code and components in the pipeline.

